
 MONA OS 2.0
 Hợp tác với MONA


 Tự động hoá doanh nghiệp
 Cẩm nang SEO
 Digital Marketing
 Kinh nghiệm thiết kế website
 Hạ Tầng Server
 Giáo dục


 VI
 EN















Message us on
Zalo Official


 ProductsNew

 ProductsProducts
 Mới ra mắtKHA AI 2027App tự edit video, tự đăng mọi mạng xã hội, 2 phút mỗi ngày










 Thiết kế websiteVừa đẹp vừa thuyết phục được khách.
Dịch vụ SEOKéo về khách đang tìm đúng thứ anh chị bán.
 Tư vấn digital marketingKéo khách từ nhiều kênh, đo bằng số thật.
Quay video doanh nghiệpVideo giới thiệu công ty, nhà xưởng, đội ngũ.
 MớiDựng video AIDựng phim câu chuyện công ty bằng AI.
 Custom software developmentCRM, ERP and HRM built for your business.
 Viết AI Agent theo yêu cầuĐặt riêng một trợ lý AI cho đúng việc của mình.
 Tư vấn chuyển đổi AIĐưa AI vào vận hành của cả công ty.
NewMONA LMSManagement for centers and schools.
MONA SkillHubInternal training for company staff.
 NHTQ systemEnd-to-end China–Vietnam shipping operations.
MONA JMSManagement for gold, diamond and pawn shops.
 MONA E-LearningA website with every feature you need to sell courses.
 How to sell online courses (course)More than 30 free lessons on selling courses on autopilot.
 MONA Cloudmonacloud.vnServers to get your apps and websites running.
 MONA Basemonabase.vnPostgres database, sign-in and file storage.
 MONA Mailmonamail.vnSend OTP, order and invoice emails from your software.
 MONA Paymonapay.vnAccept bank transfers via VietQR and notify your software when the money arrives.
 MONA eInvoiceComing soonIssue e-invoices that meet tax standards.
Gấu CườiTrả lời khách 24/7 trên web, Fanpage, Zalo và thu lead cho sale.
 Gấu TeleSalesGọi điện tư vấn, chăm khách như tổng đài viên thật.
Dê CườiTư vấn và chốt đơn cho shop ngay trong khung chat.
Gấu WebmasterNhắn nhóm Zalo là website được sửa xong.
 Gấu Pháp ChếSoạn hợp đồng, rà điều khoản trong vài phút.
 Gấu Báo GiáLên báo giá đúng mẫu và gửi khách ngay.
 AI chăm sóc khách hàngTheo dõi và giữ chân khách hàng cũ.
 Gấu Tuyển DụngLọc hồ sơ, hẹn lịch, phỏng vấn ứng viên.
 Mới ra mắt
KHA AI 2027
Xây kênh chuyên gia 2 phút mỗi ngày
Quay bằng điện thoại, AI tự edit video, tự đăng lên 16 nền tảng và tự trả lời bình luận, tin nhắn.
875.983lượt xem trên kênh CEO MONA sau 35 ngày
 Anh Khánh HùngCEO MONA đang dùng mỗi ngày
Xem app làm được gì
 AI
Gấu Cười MONA ĐANG TỰ XÀITrả lời khách 24/7 trên website, Zalo OA, Messenger và thu lead về cho sale.
Dê CườiChốt đơn bán lẻ và sàn: Shopee, TikTok Shop, web. Chăm cả khách sỉ, đại lý.
Gấu WebmasterCập nhật nội dung, tối ưu SEO website mỗi ngày.
Gấu TeleSalesGọi điện tư vấn, chăm khách như tổng đài viên thật.
Gấu Tuyển DụngLọc hồ sơ, hẹn lịch, phỏng vấn ứng viên tự động.
AI chăm sóc khách hàngGiữ khách cũ, cứu lead đã rớt cho phòng kinh doanh.
Gấu Pháp ChếSoạn hợp đồng, rà điều khoản trong vài phút.
Gấu Báo GiáLên báo giá đúng mẫu, gửi khách ngay khi có yêu cầu.
 Chuyển đổi AI toàn phầnGiải pháp tổng cho doanh nghiệp, 3 lớp triển khai.
 Viết AI Agent theo yêu cầuĐặt riêng một con AI gánh đúng nghiệp vụ của bạn.
 Custom softwareCRM, ERP and HRM with built-in AI automation.
 SEO & AEO thời đại AIĐược Google lẫn AI trích dẫn, không chỉ xếp hạng.
 Kiến thức AI cho doanh nghiệpBài phân tích, hướng dẫn ứng dụng AI vào vận hành.
 Free AI courses
 AI tools at work
App mới · KHA AI 2027
Xây kênh 2 phút mỗi ngày
AI tự edit video, tự đăng mọi mạng xã hội
Free consultation, 8am–10pm every day

18 March, 2023

If you have a website but don’t know how visitors actually behave on it, you’re missing something. Why do they click here and ignore there? Why do they leave straight away? Instead of guessing, a heatmap lets you see user behavior on a visual map. You learn what your customers want and can improve the website to increase revenue. Let’s MONA Media look at what a heatmap is and go through the 9 best heatmap tools available today.
A heatmap is a data visualization that uses color to show how concentrated data is at each position on a surface. Warm colors such as red or orange usually mean high concentration, while cool colors such as blue or green mean lower levels.
On a website, heatmaps are used to track how users interact with a page. With a heatmap you can easily see where users click, how far down they scroll, and which parts of the content get a lot or little attention.

With this visual format, website owners can quickly spot behavior patterns on a landing page. That gives the business a solid basis for adjusting the layout, refining the design and improving the user experience.
Using heatmaps in website analysis helps you optimize your site more effectively, UI UX lowers bounce rate, raises conversion rate and helps the business grow revenue.

A heatmap shows user behavior on a website through areas of different colors. To analyze behavior more fully, heatmaps are usually split into several types, each reflecting a different kind of interaction. Below are the three types most commonly used when optimizing a website.
To optimize a website well, you need to understand how users behave on each page. Instead of relying on statistics alone, heatmap software lets you see the areas users click, scroll or look at most. The business can then adjust the layout and content to improve the experience and raise conversion rate.

Reasons to use heatmaps to optimize your website:
To understand how users interact with a website, many businesses now use heatmap software. These tools visualize behavior such as click positions, the areas that get the most attention and how far people scroll on each piece of content. You can then see what to improve to make the experience better and raise conversion rate. Below are the 8 most popular heatmap tools used by marketers and website managers today.
Microsoft Clarity is a free heatmap tool built by Microsoft and used by many marketers and website managers to track user behavior.
It offers session recordings, heatmaps and automatic analytics reports. Clarity can also be connected to Google Analytics, which makes it easier to track and analyze how users interact with your website.
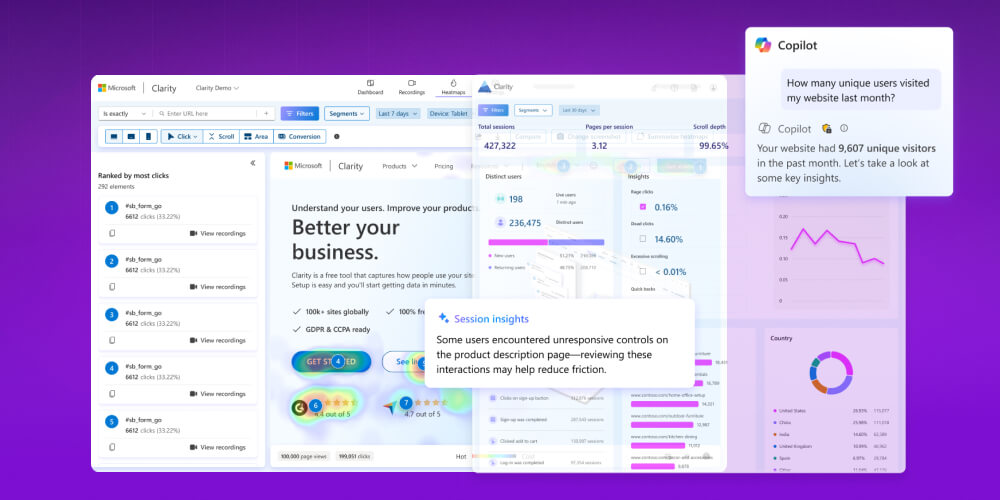
However, compared with tools such as Smartlook, the heatmap features in Microsoft Clarity are still fairly limited. It doesn’t yet capture dynamic page content, such as a menu that appears on hover, and it has no move map for tracking mouse movement in more detail.
ClickTale is one of the user behavior analytics tools many businesses choose when they want to track data through heatmaps. It shows how users interact with your website, so administrators can see which areas of a page attract attention and need further optimization.
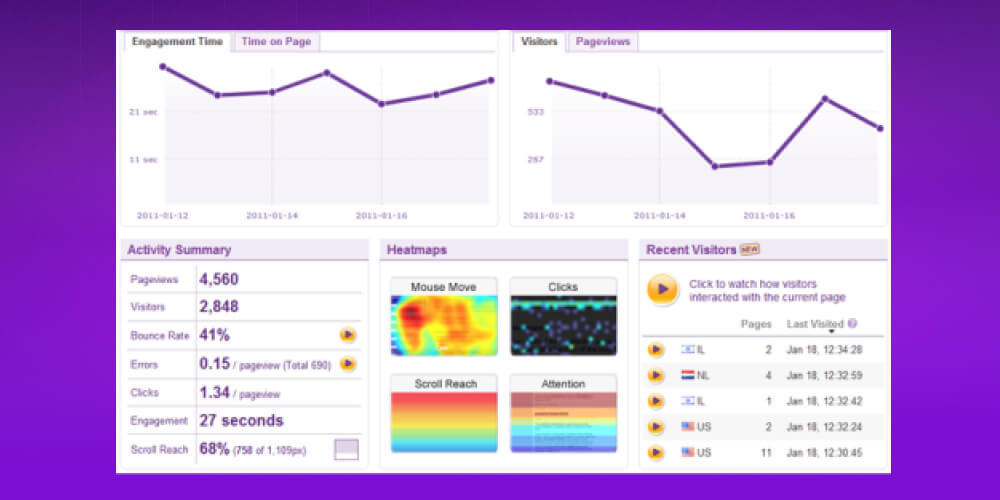
ClickTale stands out for its in-depth data analysis, which makes it easy for a business to judge how well the user experience is working. It also connects with popular analytics platforms such as Google Tag Manager and Google Analytics, which makes tracking and consolidating data easier while you optimize your website.
≫ What is Google Analytics? A beginner’s guide to Google Analytics
SeeVolution is one of the user behavior analytics tools many businesses choose to check heatmaps on their website. It is well rated for an easy-to-use interface that suits even beginners. SeeVolution also offers plugins for many popular website platforms, so installation and use are quick and convenient.
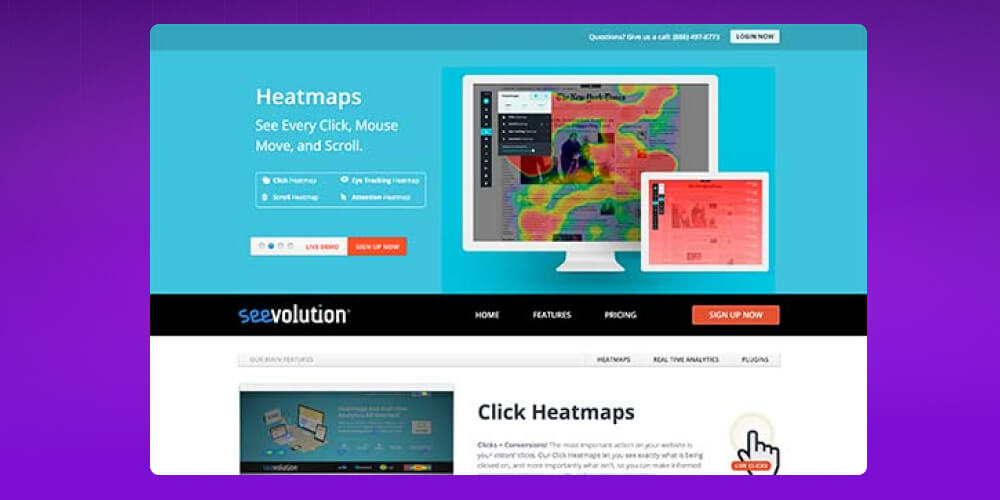
SeeVolution also has a clear dashboard that makes the data easy to follow and understand. It gives full information on behavior such as clicks, mouse interaction and mouse movement on the page. With this detail, a website manager gets an overview of how the site performs and can make suitable adjustments to improve the user experience.
Hotjar is a heatmap tool used by many businesses and marketers to analyze user behavior on a website. It stands out for combining several features: heatmaps, session recordings, form analysis, user surveys and feedback tools. As a result, Hotjar not only tracks how users interact with your website but also helps you improve the experience and conversion rate.

With Hotjar you can easily track behavior such as clicks, taps, scrolling and mouse movement through heatmaps. It also has a clear dashboard, so you can quickly grasp the data and spot problems that hurt your website’s performance. That makes analyzing and optimizing your website easier and more effective.
Heatmap.me is a heatmap tool chosen by many website managers for its simple use and clear data analysis. It tracks user behavior on a website through heatmaps, so you can easily see which areas of a page attract the most attention.
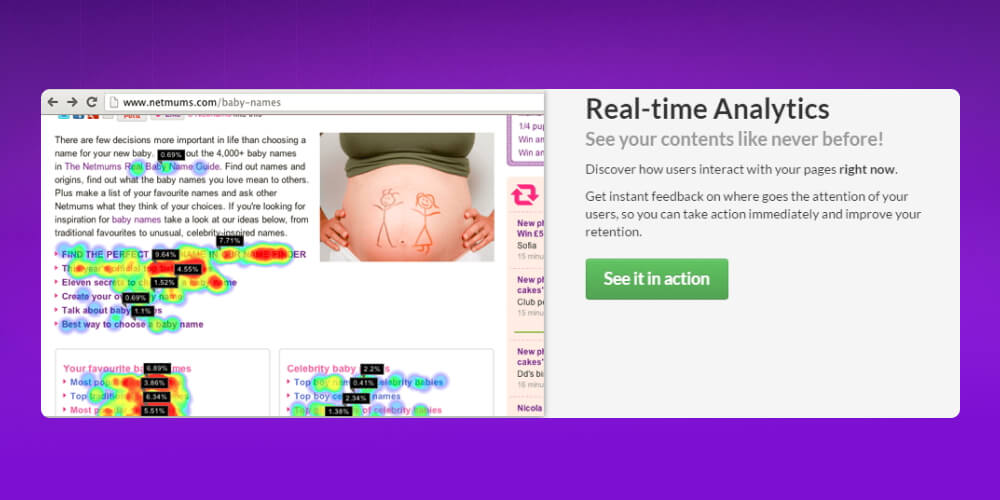
Setting up Heatmap.me is also quick. You only add a small piece of JavaScript to your website and data collection can start. The script loads asynchronously, so it barely affects page speed. The tool also offers real-time heatmaps and protects user privacy by not storing data it doesn’t need.
Ptengine is a website analytics tool that combines several features in one platform and stands out for tracking user behavior through heatmaps. Website managers can easily observe interactions such as clicks, mouse movement and the areas users pay the most attention to.
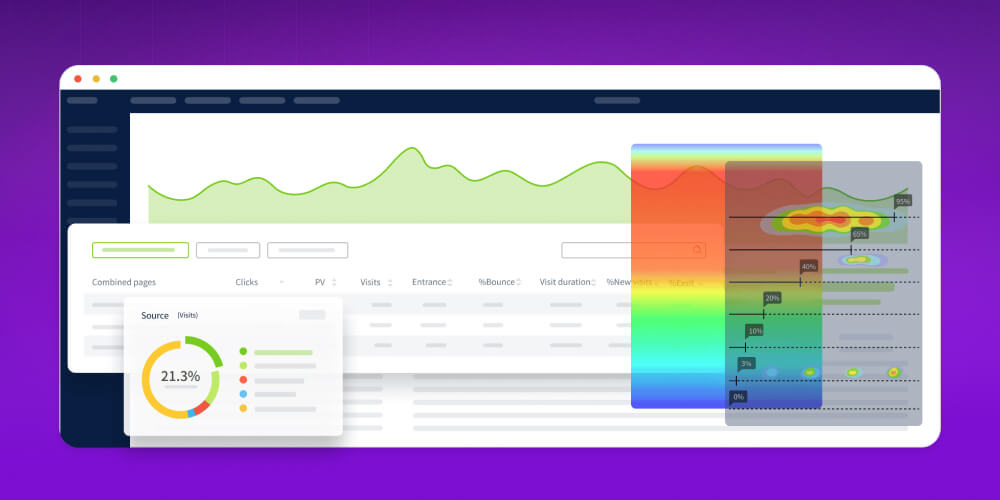
Besides visual data from heatmaps, Ptengine supports A/B testing to compare different versions of a layout. This lets designers and marketers test, evaluate and choose the layout that best improves the user experience on the website.
Inspectlet is a user behavior analytics tool that lets a business view heatmaps to understand how visitors interact with each area of a page. It supports the common heatmap types: clicks, scrolling and cursor movement, giving clear data on how interested users are in each piece of content.
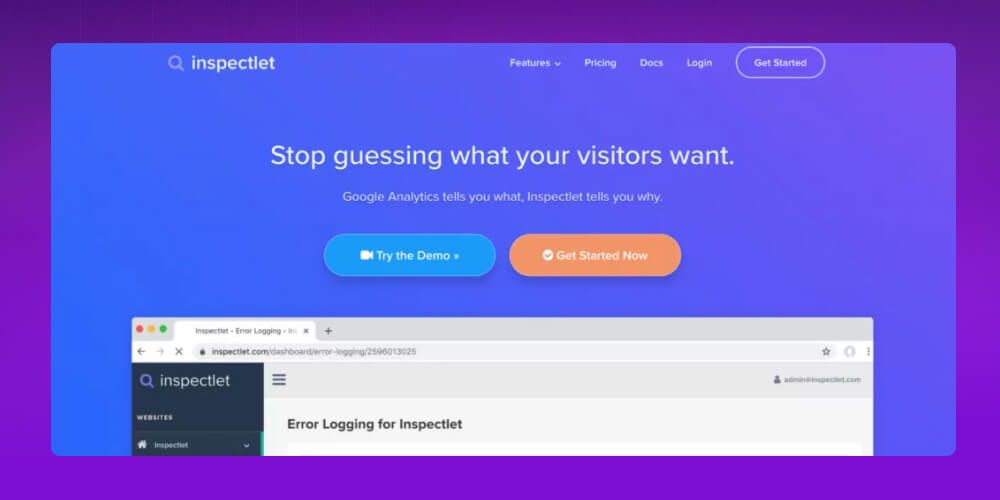
Inspectlet also includes funnel analysis and powerful data filters, so administrators can track and analyze the behavior of each user group. That makes it easier to optimize the experience and improve how the website performs.
Crazy Egg is a heatmap app used by many businesses to analyze user behavior on a website. It tracks interactions such as clicks, mouse movement and the areas of a page users pay the most attention to.
Crazy Egg’s standout feature is the Confetti Heatmap, which breaks data down by traffic source, such as social media, search engines or other channels. A business can see how visitors from each source interact with the website and optimize the experience accordingly.
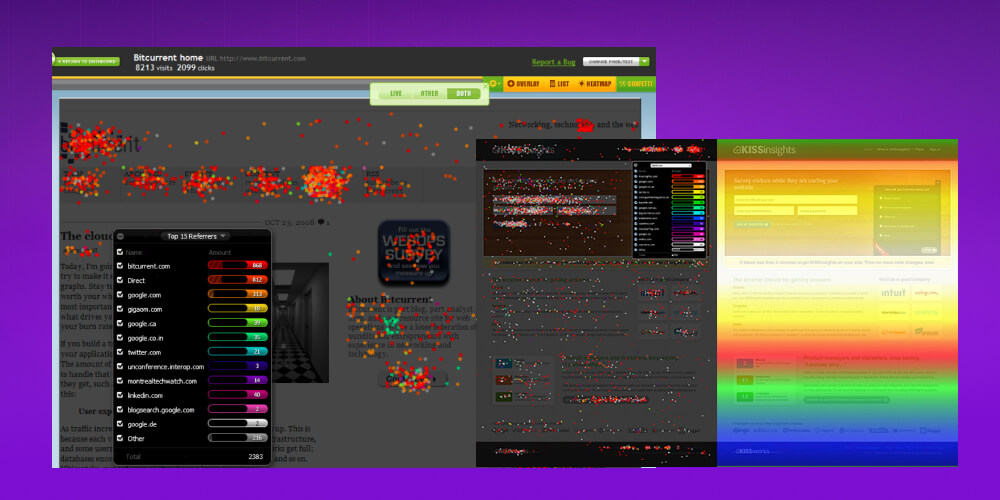
Mouseflow is a heatmap app for tracking and analyzing user behavior on a website. It provides data on clicks, mouse movement and attention levels across each area of a page, so administrators understand how visitors interact with the site.
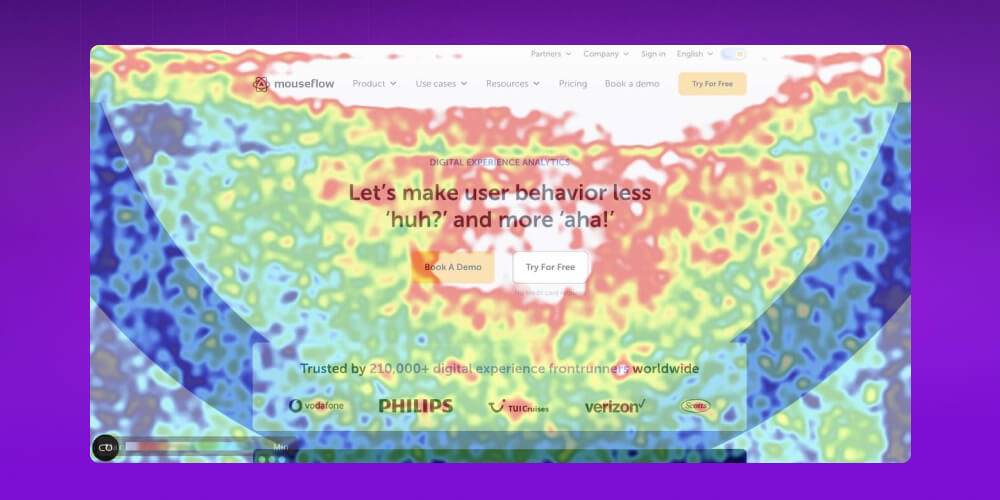
Mouseflow also records entire sessions so you can watch real user behavior. It has form analytics too, which shows why users don’t finish a form or leave the page, making it easier to improve the experience on your website.
Many businesses already have data from heatmaps, Google Analytics or other behavior tracking tools, yet they don’t know where to start optimizing their website. The site gets traffic but doesn’t convert, visitors look and leave, and the data keeps piling up with no clear way to use it.

With years of experience in website design and optimization, the MONA team has helped hundreds of businesses improve website performance, speed up page loading and improve the user experience. We optimize websites to the SEO-readystandard, covering speed, security and conversion. When you use website optimization service at MONA Media, you get:
If you want to optimize your website to improve page speed, the user experience and business results, contact MONA to get advice on the solution that best fits your website.
Once you know what a heatmap is and have picked a tool, the next step is to set heatmaps up on your website and start collecting user behavior data. The process is fairly simple and takes just a few basic steps.
First, choose a heatmap tool that fits your needs and budget. Popular options today include Hotjar, Microsoft Clarity, Crazy Egg and Pendo. Each has its own features, so think about what you want to analyze before choosing.

After choosing a tool, create an account and confirm your email. Then enter the URL of the website you want to track so the system can start setting up data for your site.
Most heatmap tools give you a JavaScript snippet for tracking data. Copy it and paste it into the <head> section of your website. You can also install it through Google Tag Manager, which makes it easier to manage.
After installing the tracking code, pick the important pages where you want to analyze user behavior.
For example, the home page, product pages, landing pages or the checkout page. These areas have the most direct effect on the user experience and conversion rate.
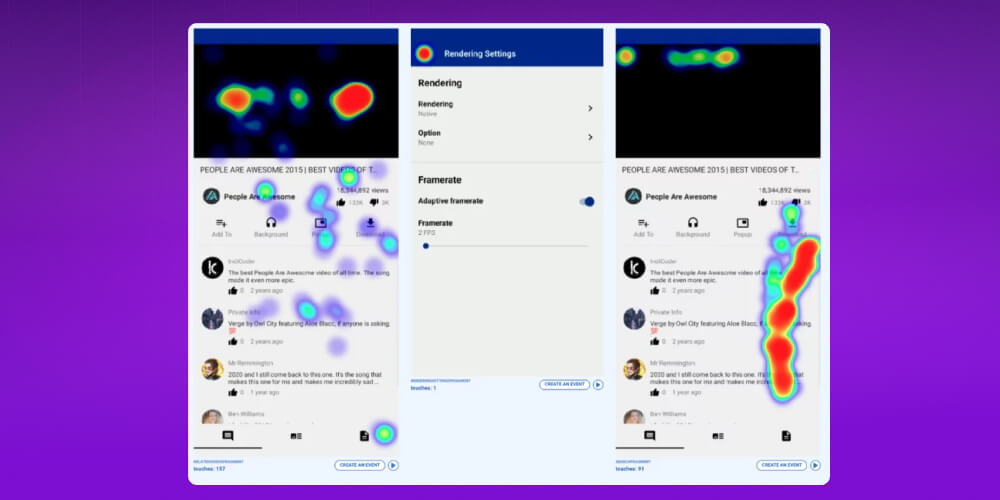
Once the system starts collecting data, you can follow user behavior through several types of heatmaps, such as:
From heatmap data you can see the “hot spots” (red or yellow) where users interact a lot and the “cold spots” (blue) that get little attention.
Based on this, you can adjust the layout, content or placement of call-to-action (CTA) buttons to improve the user experience and raise your website’s conversion rate.
A heatmap is a very useful tool for analyzing user behavior on a website. To get the most from the data, though, you need to know how to read it and apply it sensibly. Used well, a heatmap not only shows you how users interact with a page but also helps you improve the design and content and raise conversion rate.
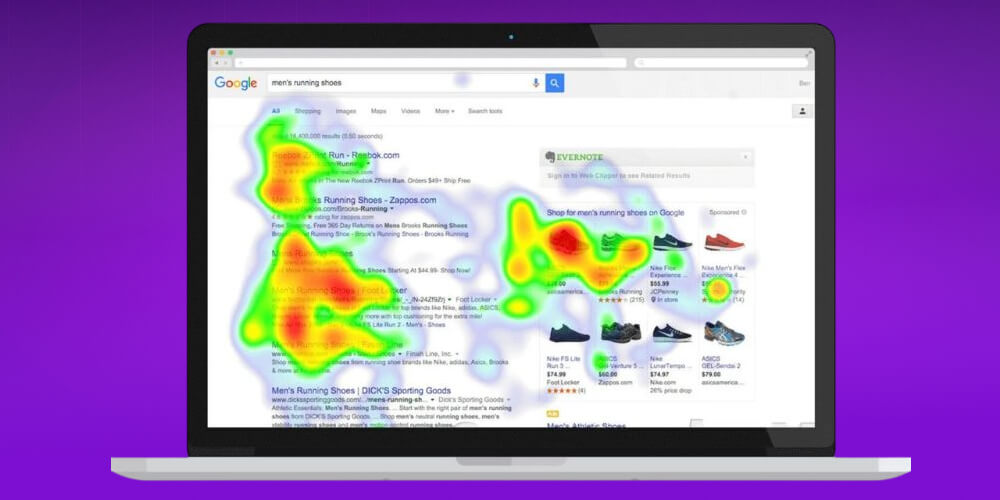
Specific tips for getting strong results from heatmaps:
Using heatmap software is essential for managing and getting the most out of a website. Knowing what a heatmap is and which heatmap tools are well rated is useful information, and it makes analyzing and improving a website much simpler for individuals and organizations alike.

CEO & Founder · The MONA
Founder of The MONA, who built a services company of 60+ staff with 14,000+ projects delivered. Khánh Hùng shares how he thinks about building systems that run themselves, automating a business, and the real lessons from delivering projects at MONA.
 1,6K




Professional website
design services
Own a website with a beautiful, 100% exclusive design and a lifetime warranty, with the ability
to expand features flexibly as your business grows, starting today!






 MONA will never sell your information or send you spam


 MONA will never sell your information or send you spam
