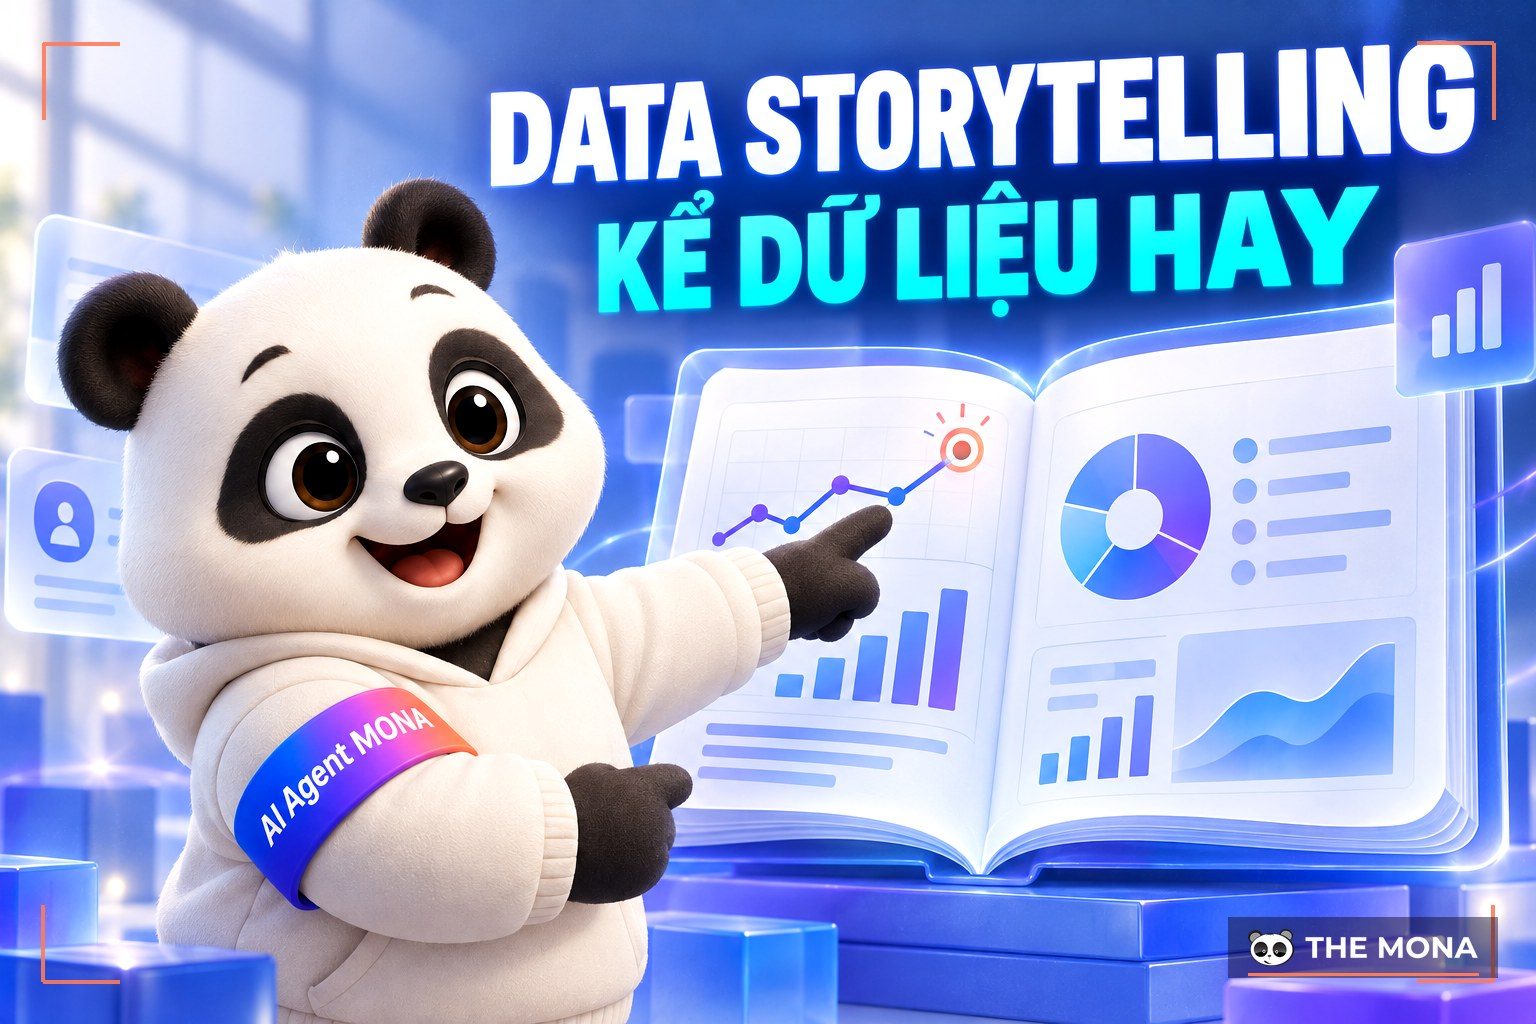
Quick summary: Data Storytelling means building a compelling story from data and complex analysis to deliver a message to a specific audience.
Data Storytelling can be seen as the art of storytelling in marketing, aimed at a target audience. Telling a brand story well takes deep knowledge of the company's products and services, plus the skill to write vividly and memorably. Let's look at Mona Media take a closer look at what Data Storytelling is and go through the 5 fastest ways to write Data Storytelling with genuinely engaging content in this article.
What is Data Storytelling?
Data Storytelling means building a compelling story on top of data and detailed analysis. It carries your message so it can influence and inform a specific audience, and it lets you present data clearly, vividly, persuasively and meaningfully. A good data story has three main elements: narrative, visuals and data. The narrative connects the events, characters and ideas in your story. The visuals turn data into pictures that highlight the key points and hold the viewer's attention. The data is the foundation of the story, supplying evidence and deeper insight. -> What is data? The role of data for businesses
Why Data Storytelling matters for businesses
Data Storytelling matters to businesses. Here are the reasons to use it:
Makes data engaging and easier for your audience to remember
Data Storytelling makes data more engaging and helps readers remember it. It adds value and context to data by turning dry numbers into stories with real content and meaning. As a result, customers recall a company's figures faster than they would with traditional presentation.
Holds attention
Data Storytelling is valued because it holds the reader's attention. It illustrates and explains abstract, complex concepts and brings out the key points in your content. With charts, graphs and diagrams, readers focus more easily and remember information faster.
Makes use of all the data you have
Another advantage of Data Storytelling is that your business gets the most out of the data it already has. It lets you:
Find important, meaningful insights in the data, using analysis methods such as statistics, machine learning and artificial intelligence.
Present data clearly and vividly, using visualization tools such as charts, graphs, maps, images and video.
Connect the data to your story by arranging information in a logical order with a beginning, a middle and a conclusion.
Persuade and influence your audience, using storytelling techniques such as a plot, characters, conflict and resolution.
Data Storytelling is one of the best ways to deliver information quickly and convincingly. It helps improve and fine-tune marketing campaigns by attracting customers while noticeably increasing the conversion rate. -> Read more about Storytelling Marketing: Story-driven promotional campaigns
Helps customers choose more easily
Data Storytelling creates a sense of interaction between a business and its customers by letting the audience look at the data and draw their own conclusions. It shows the company's vision and mission, which builds trust and credibility in the industry and makes the choice easier for customers.
How to tell stories with data (Data Storytelling)
Data storytelling plays a very important role. Done well, it brings real benefits. Here are some methods you can use:
Start with a story
Starting with a story is the traditional approach in Data Storytelling, and it works well. An easy-to-follow story ties the parts of your content together and helps customers picture things far better than raw data does. Famous politicians, for example, all have their own stories. You may not remember the products they sold or the figures in their speeches, but you still remember the engaging stories they told. In any story, data alone struggles to reach the listener. So combine data with visuals, color, context or people to make it memorable.
Make data more interesting
Data is information at its core, so it has to be organized and explained sensibly to avoid confusion. Building a story around data makes it more meaningful and easier to organize. You can also present data with humor or a light touch so readers take it in more easily.
Weave the story and data into a specific context
Combining a story and data in a specific context lets you look at the same issue from different angles. Done properly, this creates a connection that helps readers remember faster.
Build connection
Data told through a story is the best way to help people understand and remember it. If your target audience feels connected to your brand's story, they will want to learn more about your business.
Understand your target audience
To tell a data story that is compelling and persuasive, you need to define your target audience clearly and understand the following:
Demographics: Age, education, occupation, location and culture all affect how your audience receives and understands your data story. Choose a target audience that fits the purpose and content of the story.
Knowledge and expertise: You need to understand how much your audience already knows about the topic. Avoid terminology that is either too specialized or too basic when you present the story.
Information needs: You need to work out whether the audience has a specific need or interest in your data story. Focus on information that gives them value and solves their problem.
Relevance of the information: The information in a data story should relate to the audience's work, interests or daily life. Connect the story to what you have in common with them or to their personal experiences, so they feel engaged and understood.
Why differentiation matters in Data Storytelling
In Data Storytelling, differentiation is the most important factor in success. A brand's distinctive qualities, woven into the story, leave a stronger impression on the target audience than the generic stories common today. If your story is not different, customers will not remember the message you want to deliver.
5 formats of data storytelling
There are 5 formats of data storytelling:
Internal communication
Internal communication is also a form of data storytelling. A message in the company chat group, an email or a phone call can all use data storytelling to pass on information.
Dashboard
A dashboard is a form of data storytelling in which the presenter shows analysis of optimization results and shares metrics related to the customer experience. A dashboard is still an overview page packed with many kinds of information, so it can sometimes overload viewers and make the content hard to remember.
Infographic
You can create infographic that look good and tell your data story vividly. An infographic combines a lot of information about one specific topic, presented in a logical order with links between the sections. Choose designs, colors and fonts that suit your content and your audience.
Reports
You can apply the Data Storytelling method to performance reports, marketing campaigns or any topic involving data. Pick charts, graphs or images that illustrate the figures and stress the key points. Combine them with narrative language that explains the causes, the consequences and the solutions to the problems.
Newsletter (email bulletin)
Newsletter is an email bulletin containing information and data on a topic the user subscribed to. Staff who apply data storytelling in a newsletter tighten up the information and use images and charts to improve the reader's experience.
Things to keep in mind when using data storytelling
To tell an effective data story, follow these tips:
Define the purpose of the story: What message do you want to send your audience? What do you want them to do after hearing your story?
Collect and analyze data: Search for and filter relevant, reliable data that supports your purpose. You also need to analyze the data to find important, meaningful insights.
Build the story's script: Arrange the information in a logical order with a beginning, a middle and a conclusion. Create links between the parts of the story so the audience can follow it.
Choose how to present it: Decide which tools you will use to visualize the data, such as charts, graphs, maps, images and video. Also choose a style, colors, fonts and so on that fit.
Check and edit: Review your story to make sure it is clear, accurate, interesting and has an impact. Edit out anything unnecessary or confusing.
This article covered what Data Storytelling is, how to do it and what to watch out for. We hope the knowledge in this article helps you understand this form of data storytelling and apply it successfully in your business.
See more:
Frequently asked questions about Data Storytelling
What is Data Storytelling?
Data Storytelling means building a compelling story from data and complex analysis to deliver a message to a specific audience.
About The MONA Group: Founded in 2016, with 60+ staff, MONA has delivered 14,000+ projects with an 85% client retention rate. MONA provides website design, full-scope SEO, custom software and AI automation solutions for businesses. Consultation hotline: 1900 636 648. Explore MONA SEO services and AI tools at work.
MONA has a podcast: listen instead of readingEpisodes on AI, automation & SEO for Vietnamese businesses
Founder of The MONA, who built a services company of 200+ staff with 14,000+ projects delivered. Khánh Hùng shares how he thinks about building systems that run themselves, automating a business, and the real lessons from delivering projects at MONA.
Own a website with a beautiful, 100% exclusive design and a lifetime warranty, with the ability
to expand features flexibly as your business grows, starting today!